Do wages tell us the full story?
In this brief, we use the Quarterly Census of Employment and Wages data to examine the distribution of wages across sectors. We specifically evaluate the wages in the largest sectors of the economy, how they have changed over the last decade, and how they compare to wages at the state level. While we focus on wages, it is important to note that wages only tell us a partial story of the region’s economy as a non-negligible share of the population receives retirement dollars, federal transfers, and investment income that will not be captured by wage data. Wages, however, tell us how much residents of the region earn and how much variation exists across sectors.
What are averages across the different sectors of the economy?
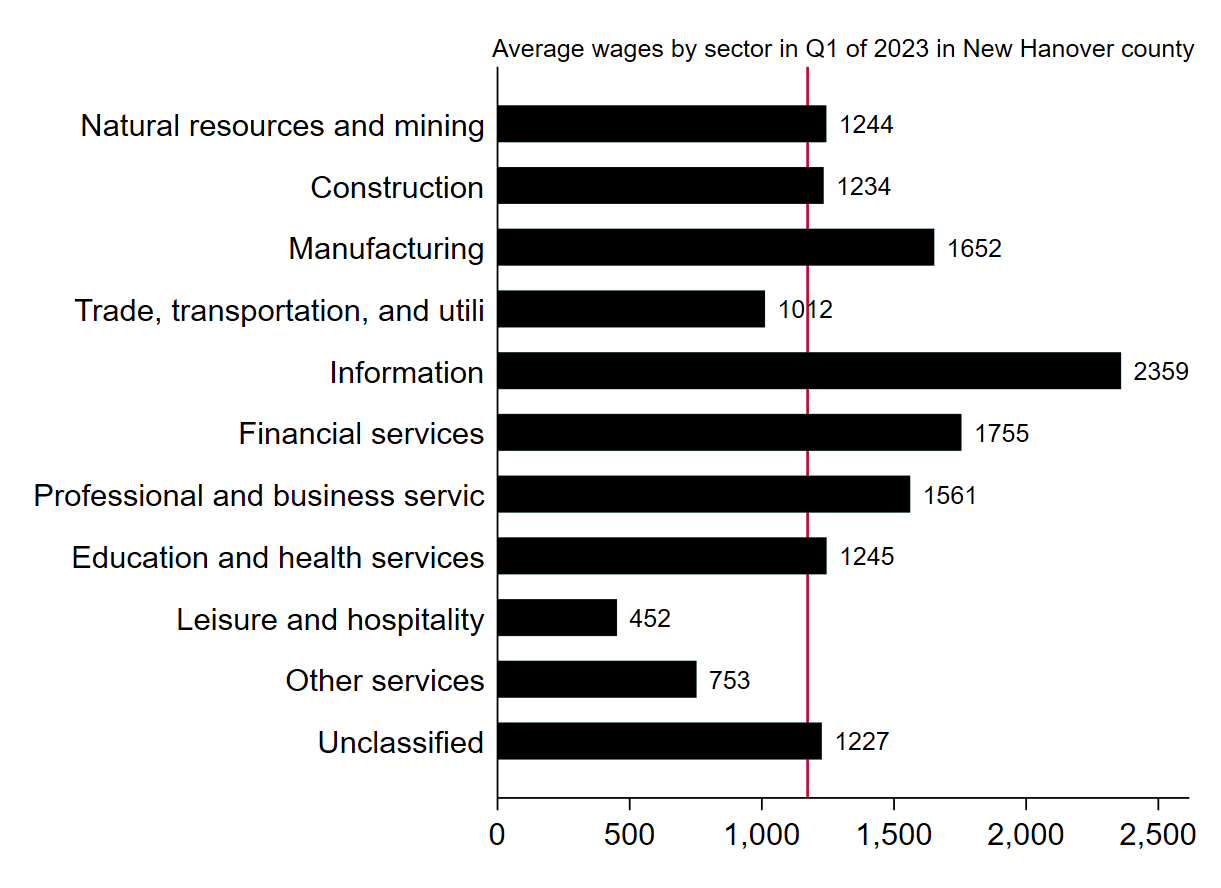
The average weekly wage in the first quarter of 2023 in New Hanover county was $1,173 dollars. The sector with the highest wage was Information which had an average wage of almost 2,359, almost twice as large as the average wage. On the other end of the spectrum, Leisure and Hospitality had the lowest wages at only $452 dollars per week. This sector includes servers who receive wages that are below the minimum wage and rely mainly on tips; therefore the wage is not fully reflective of the take home pay of these individuals.
Figure 1: New Hanover county’s average weekly wages in the private sector by industry
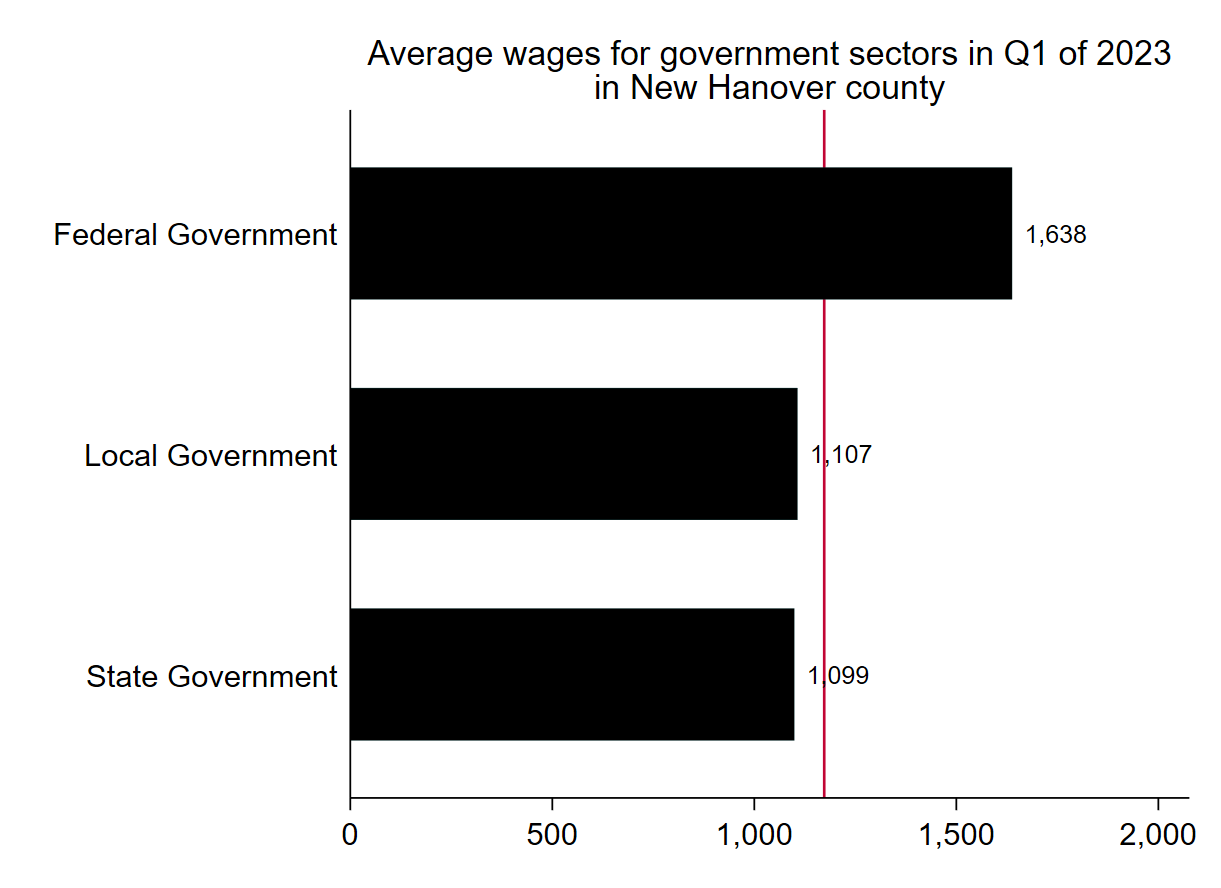
In the next figure, we zoom into the average wages in the government sector and can clearly see that the average wage in state and local government jobs are lower than the county’s average wage -as shown by the vertical line- which explains the difficulty why so many local and state government positions were difficult to fill over the last few years. Wages in the government sector tend to also be considerably stickier and less responsive to market forces which further complicates the picture.
Figure 2: New Hanover county’s average weekly wages in the government sector
How many jobs are there in the lowest paying sectors?
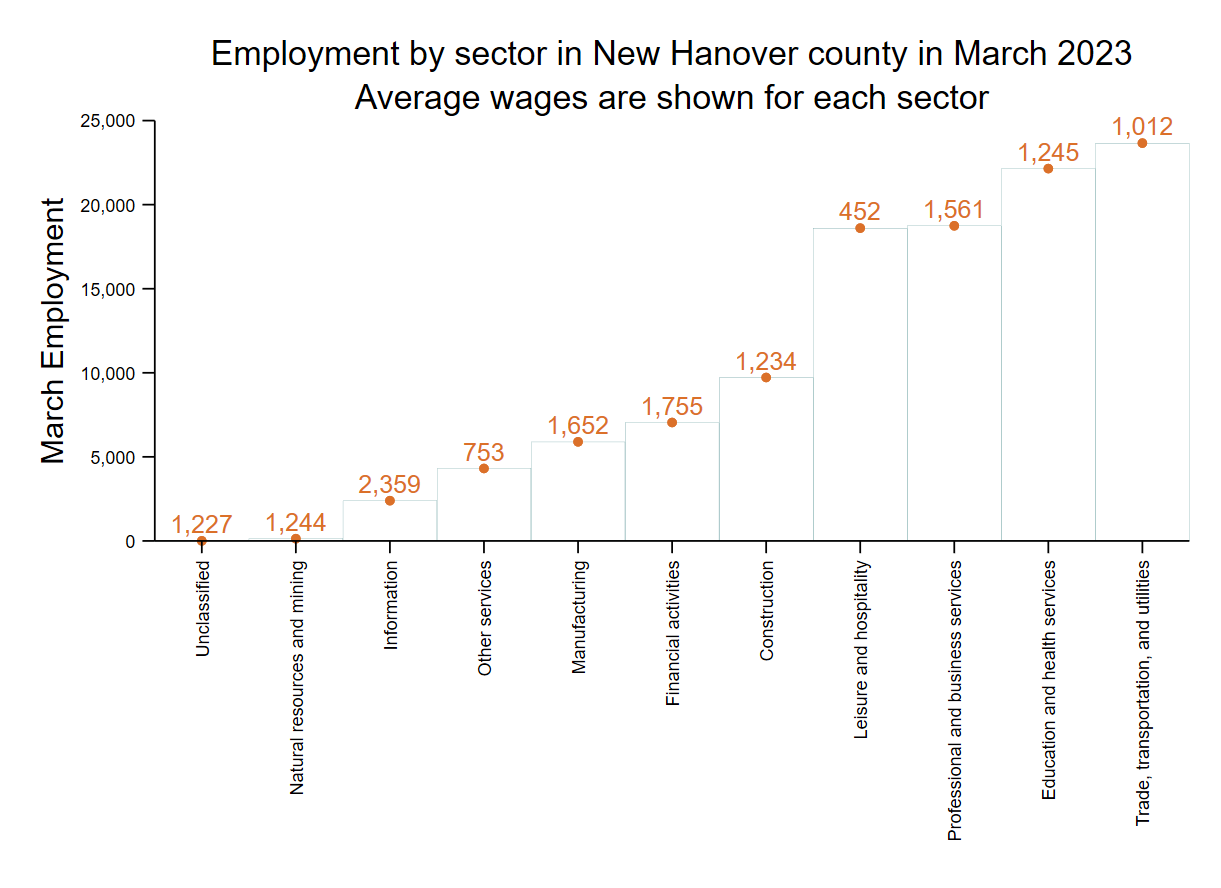
While looking at wages across sectors is important, it does not tell us anything about the purchasing power of residents of the area as it does not show the share of people who occupy jobs in each of those sectors. In Figure 3, we do just that by graphing employment by sector and show the average wage at the top of each bar. The five largest sectors in terms of employment in New Hanover county are Trade, Transportation, and utilities (23,659 jobs with an average weekly wage of $1,012), Education and Healthcare services(22,145 jobs with an average weekly wage of $1,245), Professional and Business Services(18,743 jobs with an average weekly wage of $1,561), Leisure and Hospitality(18,604 jobs with an average wage of $452), and Construction (9,721 jobs with an average weekly wage of $1,234). While there is considerable variation in earnings across sectors, 70% of all jobs in New Hanover county had an average monthly wage of less than $5,000 dollars. In Figure 3, we turn our attention to the change in wages since the pandemic.
Figure 3: New Hanover county’s employment by sector along with average weekly wages
what has happened to wages since the pandemic?
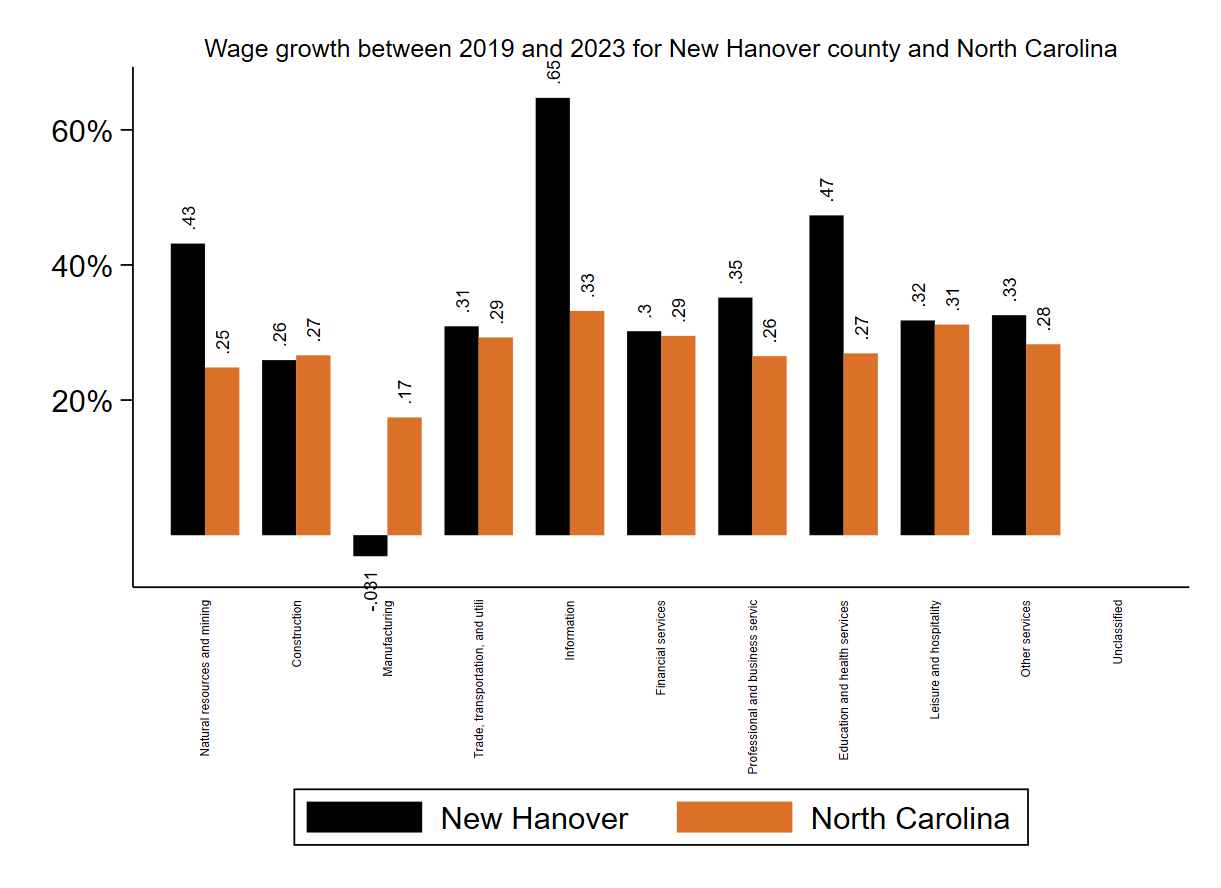
Wages in New Hanover county have accelerated significantly since 2019 due to the significant shocks to the economy as a result of the pandemic. County level wage growth has been faster than the statewide average in most sectors. The exceptions were Construction, and Manufacturing. It is important to note that given that we are using average wage data at the industry level, it is difficult to know whether the increases in average wages are due to increases in pay or increases in employment in high paying occupations within certain sectors. For example, the Education and Healthcare services sector saw an increase in wages of 47% between the first quarters of 2019 and 2023. However, we don’t know if this increase is due to a large entry of physicians into the New Hanover county market or to a faster wage growth in the wages of healthcare professionals in New Hanover relative to the state.
Figure 4: Average wage growth between 2019 and 2023
How does the wage evolution in New Hanover county compare to that of the state’s?
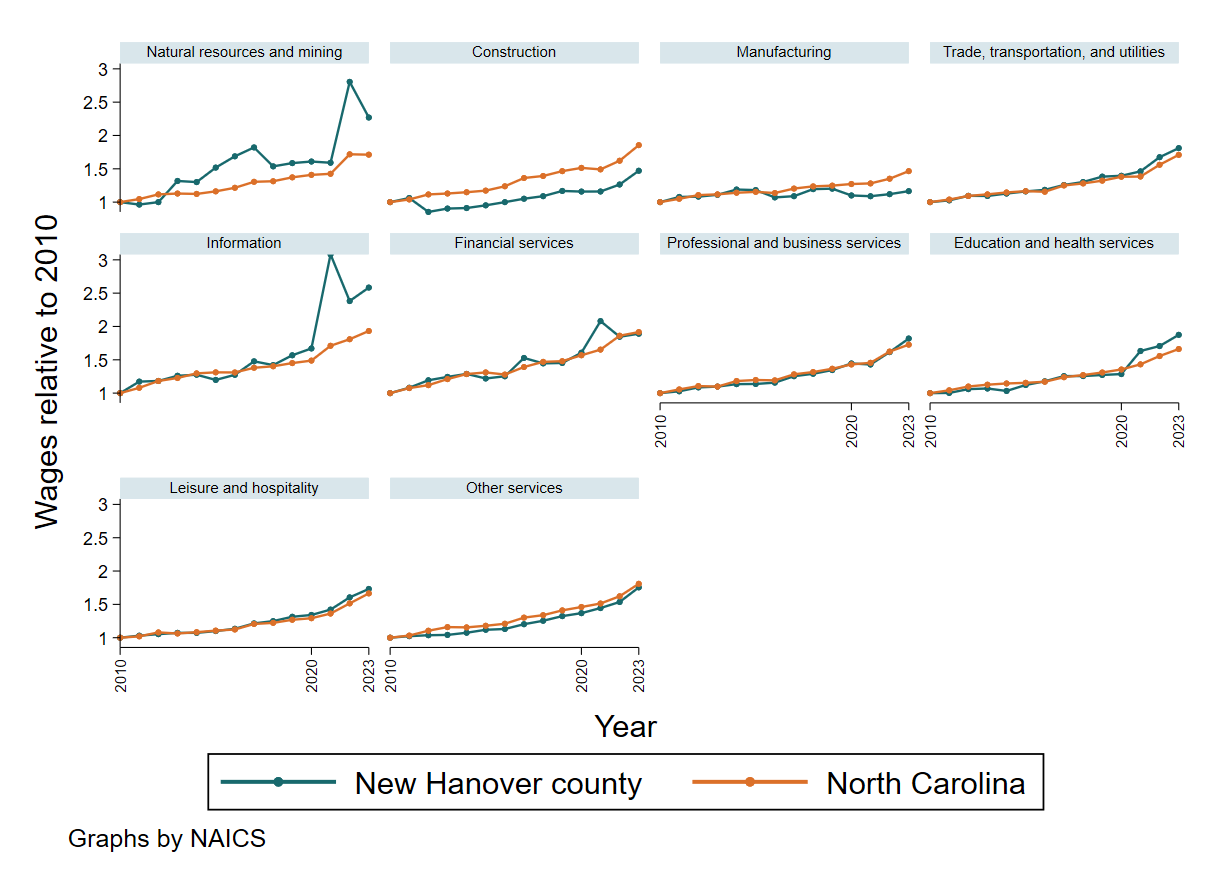
In Figure 5, we present the evolution of wages for both New Hanover county and the state of North Carolina for each private sector industry. We create an index that charts how wages have changed relative to 2010. Wages in the area have evolved at a largely similar rate to the state with the exception of the information, financial services, and education and healthcare services which have growth at a premium rate over the last few years.
Figure 5: Wage index relative to 2010 by sector
Where does this leave us?
An evaluation of wages provides a first step in understanding the type of jobs available in a region, how much they pay, and what the spending potential of the residents may be. We find that even though the region has seen considerable growth, almost 70% of jobs are in sectors with a monthly average wage below 5,000 dollars. Furthermore, we find that wage growth in the region since the pandemic has been faster than that at the state level for most sectors. Lastly, we find that the evolution of wages outside the pandemic years -2019 to 2023- has been very similar to the statewide average.