Data from the Census Bureau shows that the US population has gotten older in the past two decades, with more aging adults and fewer children under the age of 5. In this brief, we evaluate how the population has changed across North Carolina counties over the last decade. We also zoom in on the changes that have occurred over the last two years as a result of the pandemic driven migration.
Figure 1: What did the last decade across North Carolina counties look like?
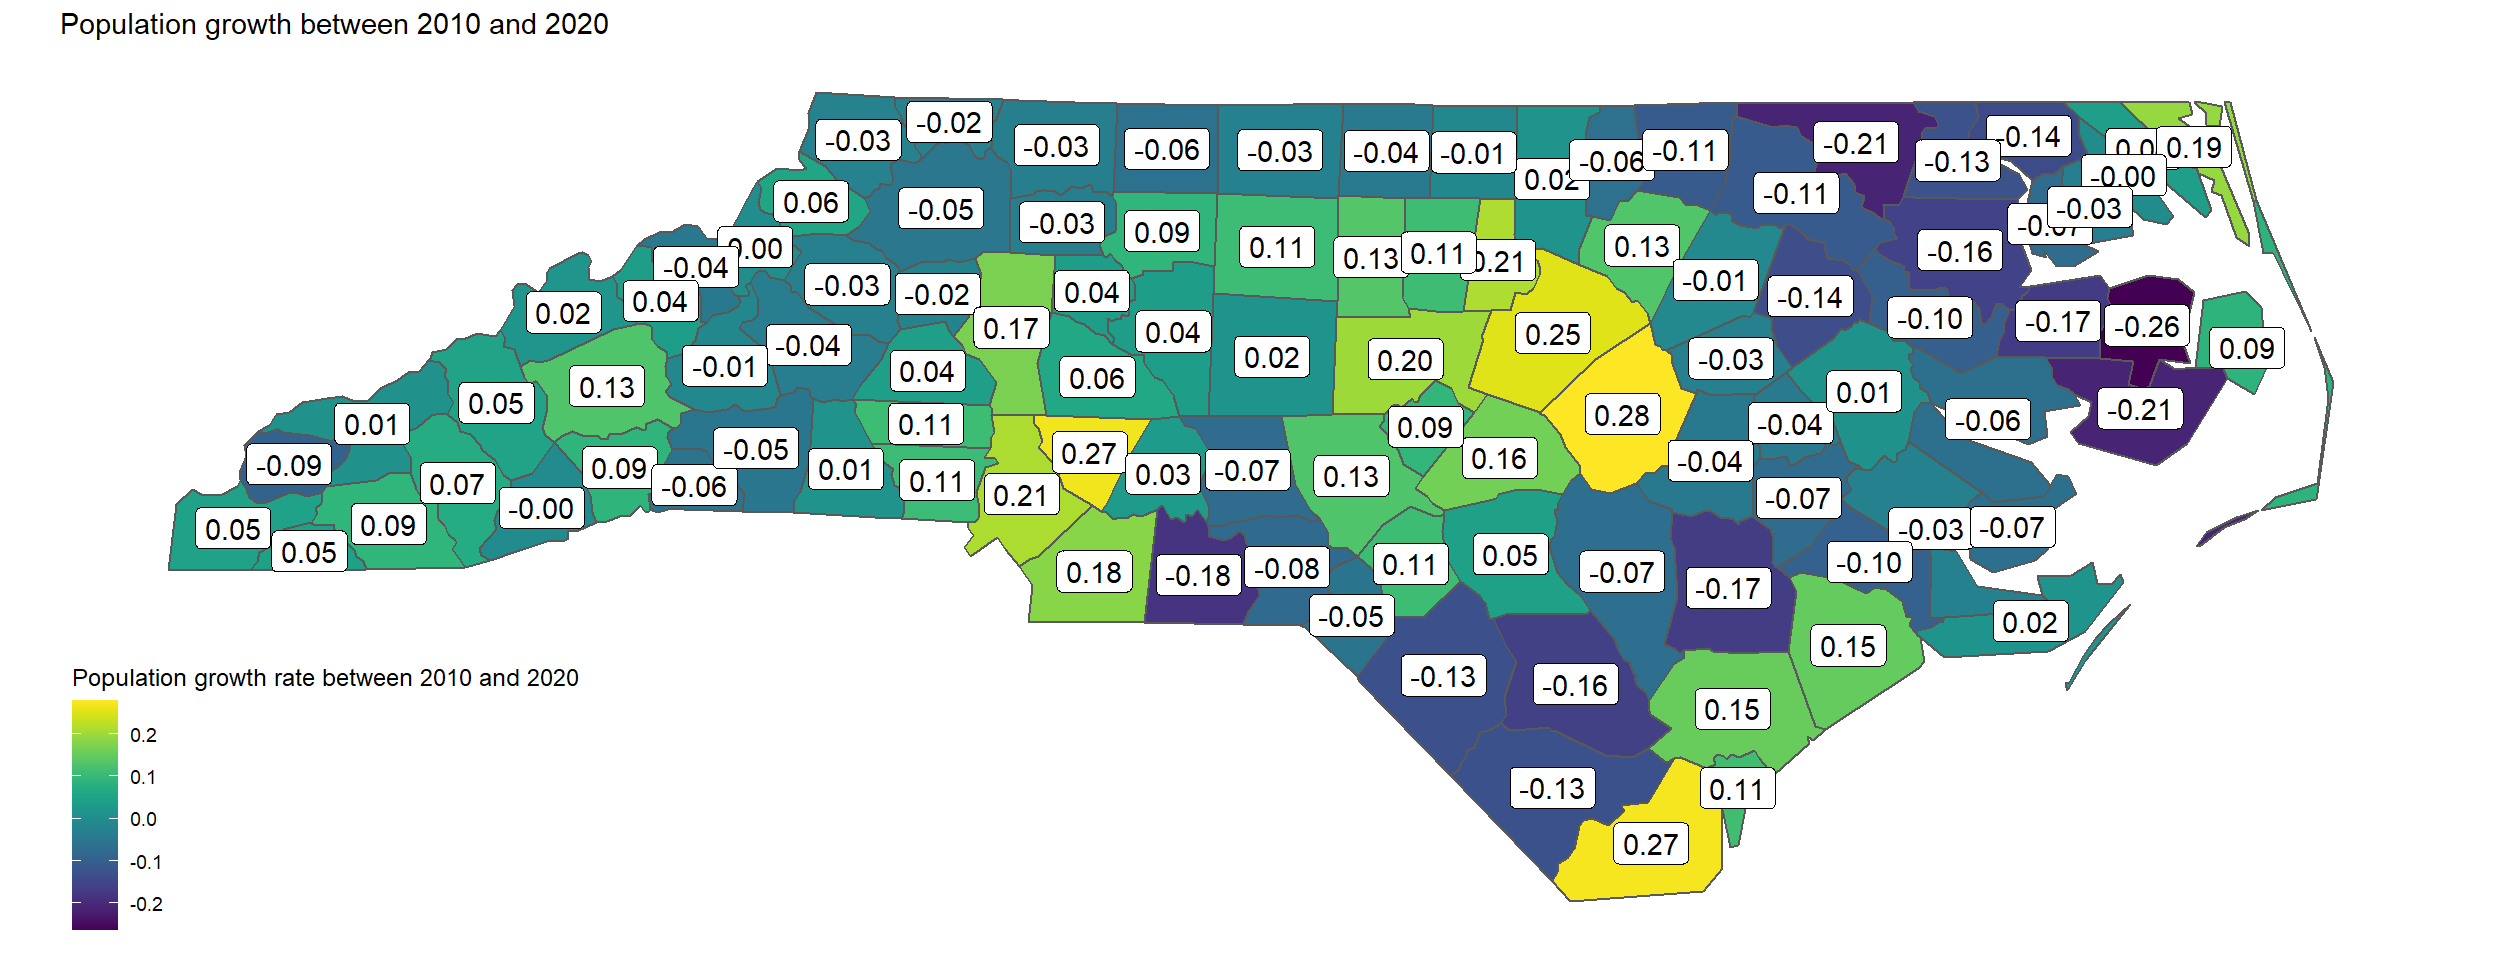
While North Carolina has received a lot of attention for its attraction of both businesses and people, this growth has not been evenly distributed. In fact, 51 of out of the 100 counties actually lost population between 2010 and 2020. Tyrell county experienced the most significant decline at (-26%) and Johnston county narrowly beat out Brunswick county as the fastest growing county at 27.8%. The counties that have lost population in the last decade are almost all ones with population in 2010 below 100,000 -with the exception of Robeson and Wayne counties- indicating that the smaller counties are getting smaller and the population growth is going towards already established urban areas.
To better highlight areas of growth, the next map shows the ranking of county growth between 2010 and 2020. It becomes obvious that the pockets of growth are highly concentrated in the counties surrounding the triangle, and a few southcentral counties. The northeastern section of the state has a high concentration of declining communities which are all relatively small.
Figure 2: Population growth rank between 2010 and 2020
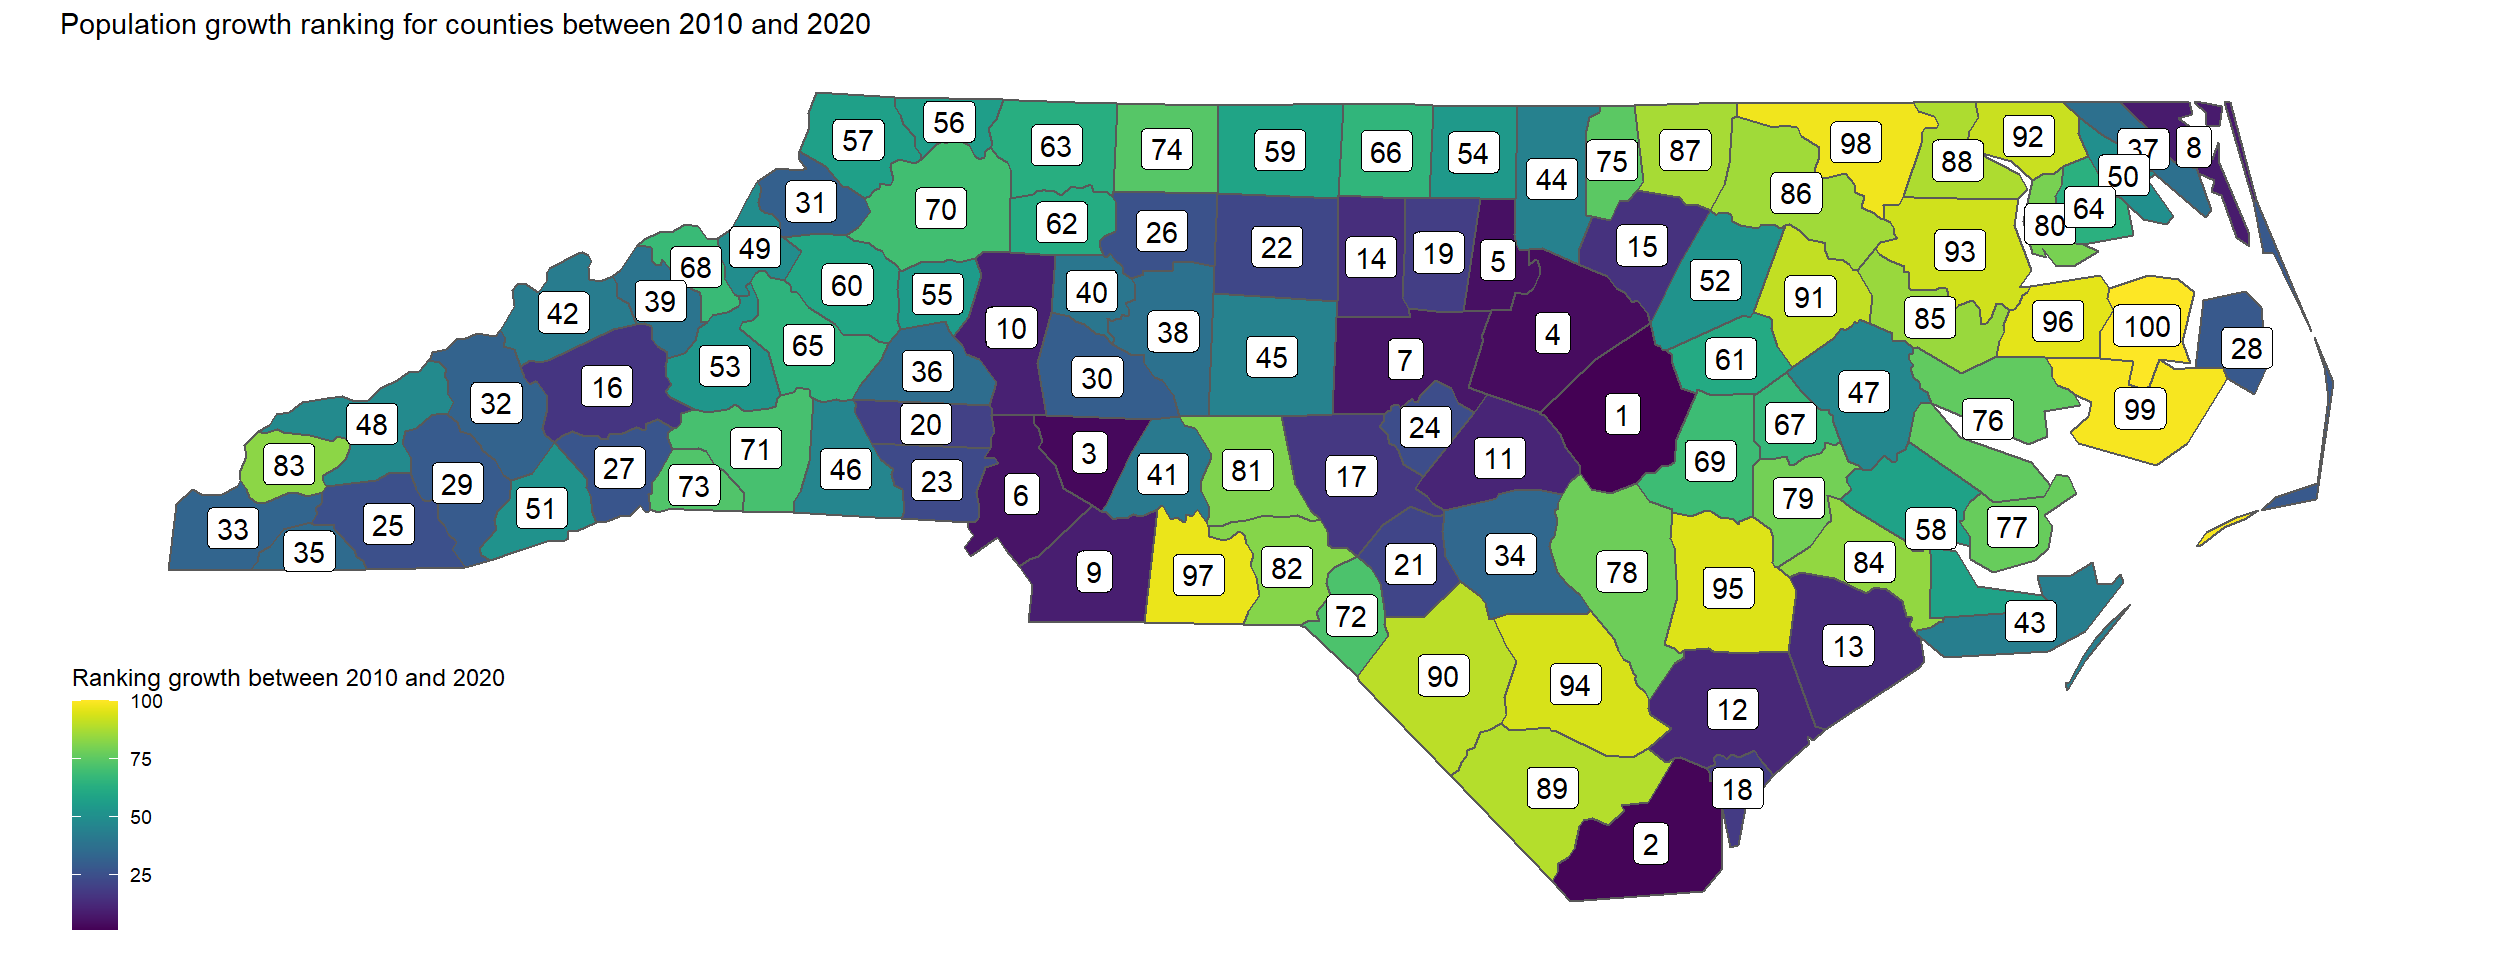
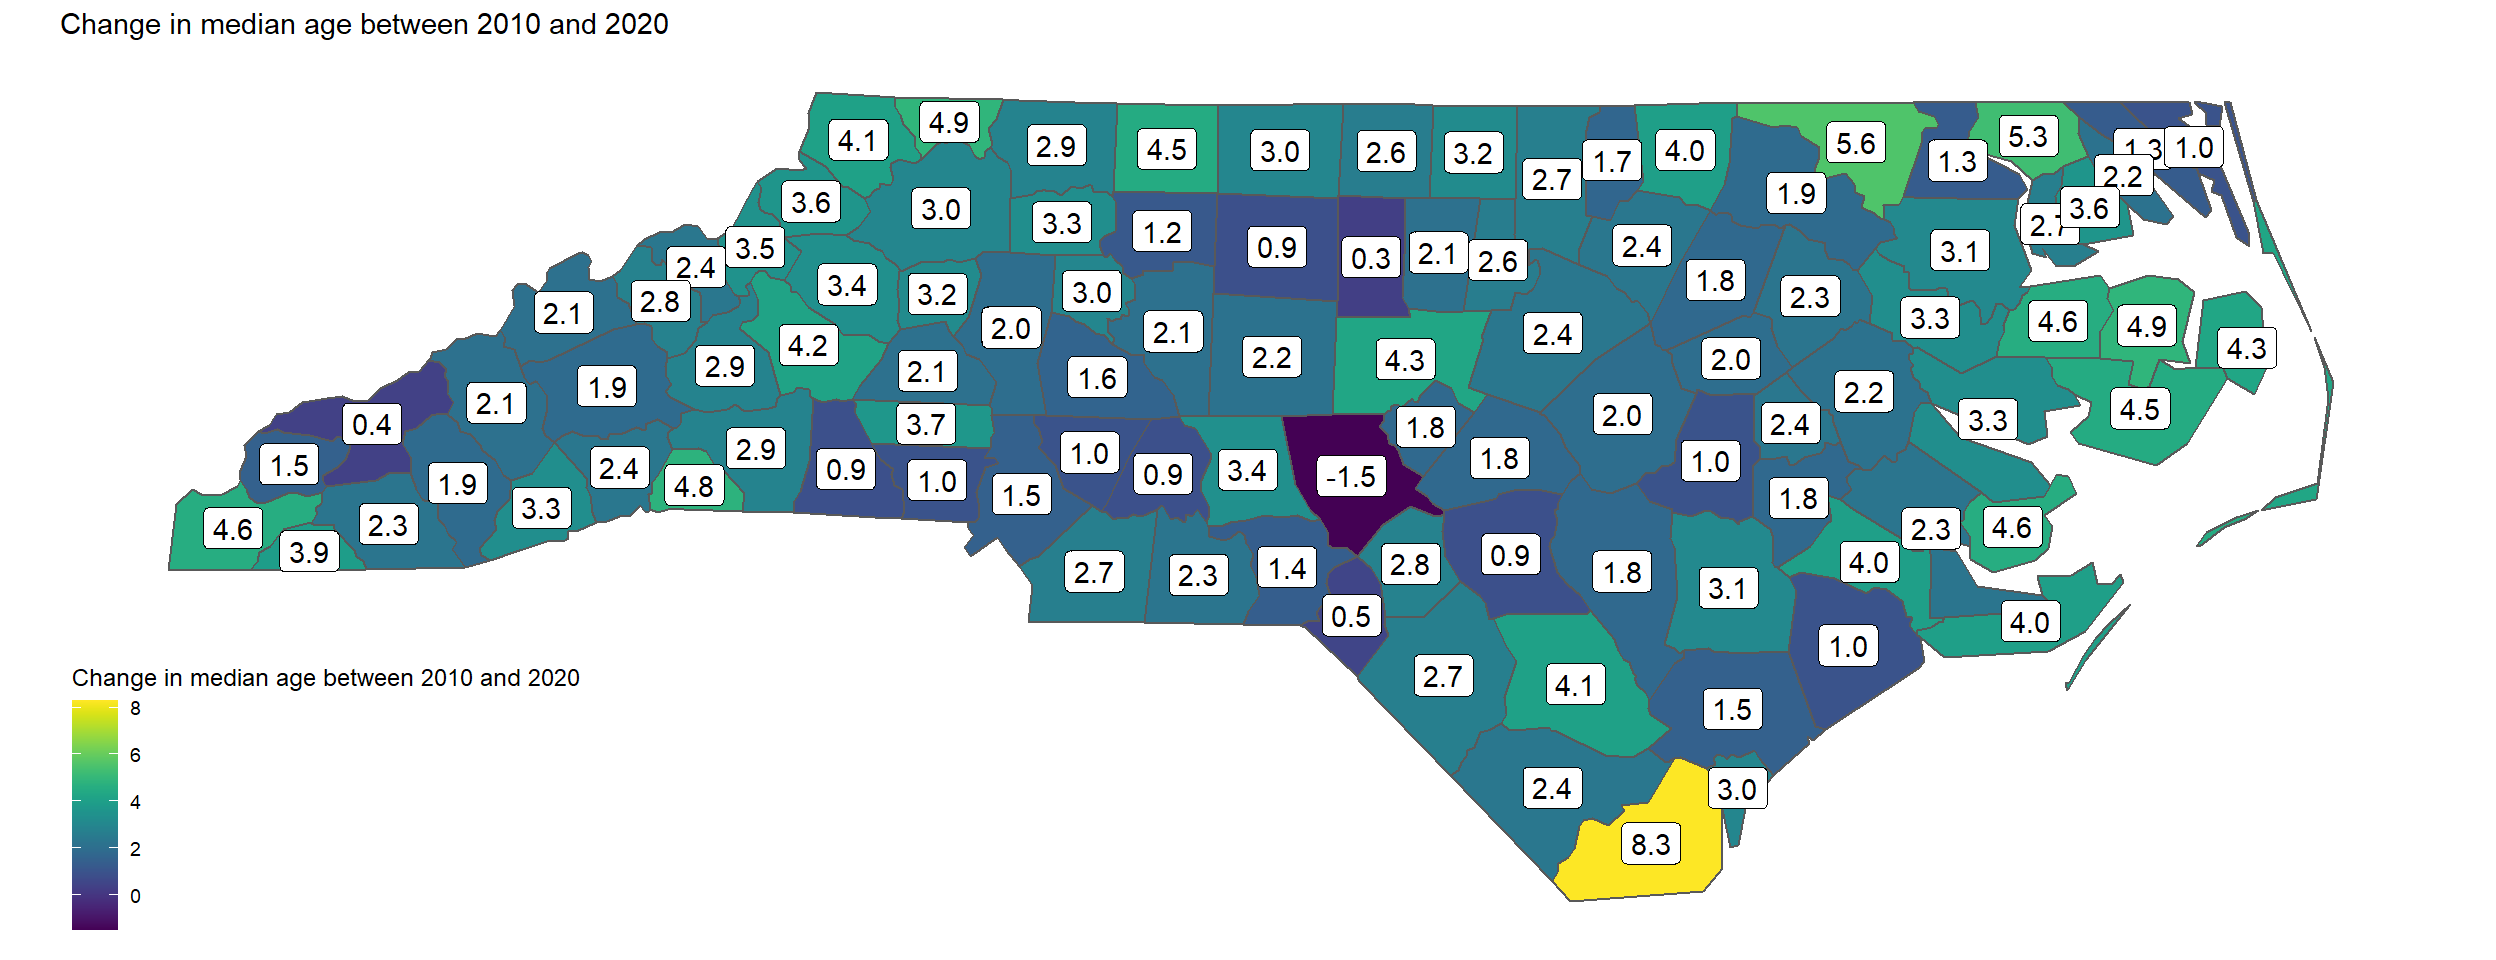
Figure 3: Change in median age between 2010 and 2020
In addition to population changes across counties, it is fairly clear to see that the state as a whole is getting older as all counties, except (Moore county), got older between 2010 and 2020. The decrease in median age in Moore county seems to be driven by younger families moving to the area. The county that experienced the most significant increase in median age was Brunswick county due to the south-bound migration of retirees. The aging of the population will have significant labor force implications if the trends do not start reversing.
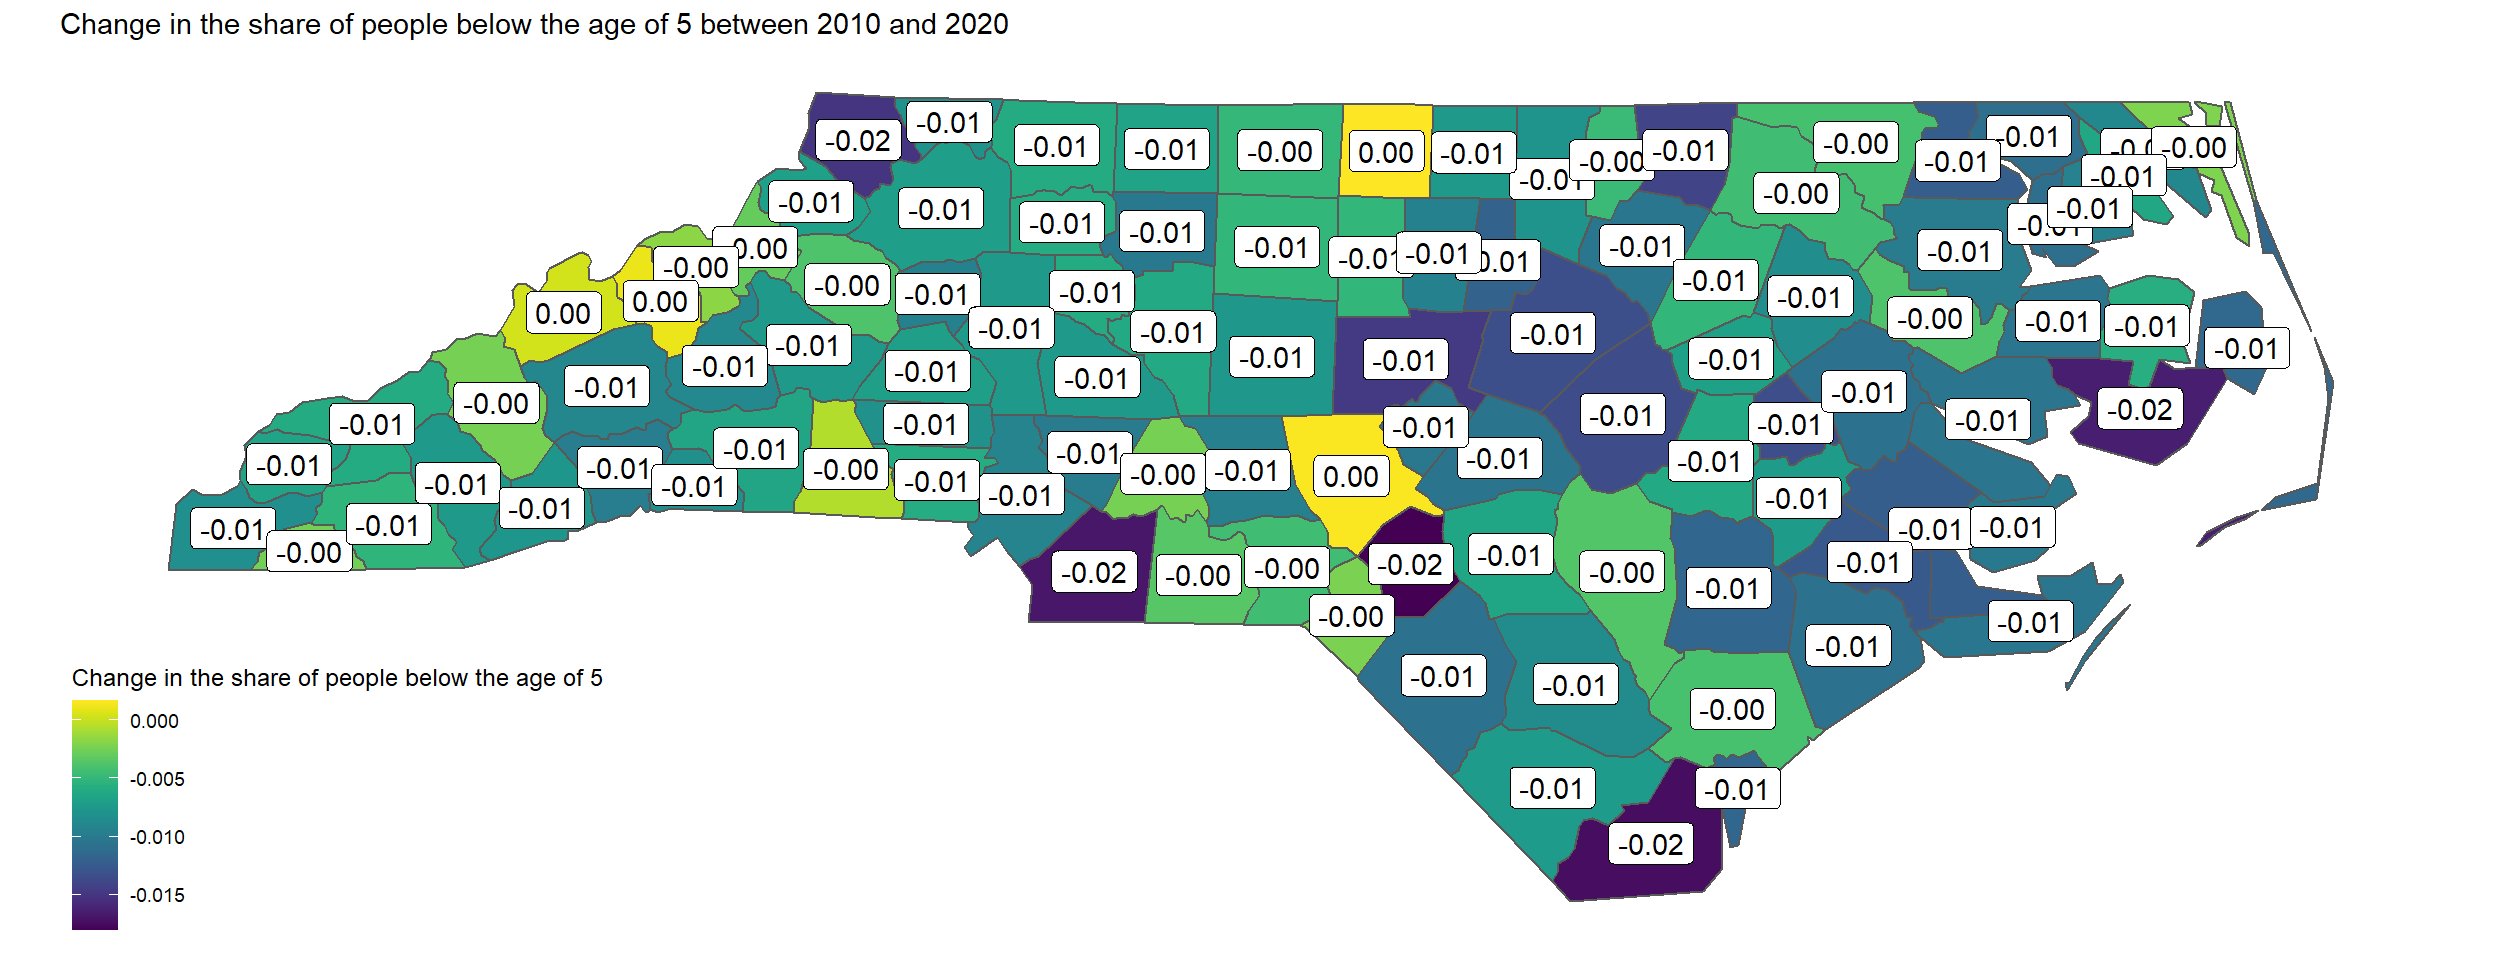
Is the aging due to a higher share of people over 65 or fewer births? Unsurprisingly, it is a bit of both as Figure 4 shows that the share of people over the age of 65 increased in every county of the state albeit with significant variation. Similarly, the share of children under the age of 5 Figure 5 decreased in the majority of counties resulting in an increase in median age.
Figure 4: Change in the share of people over 65
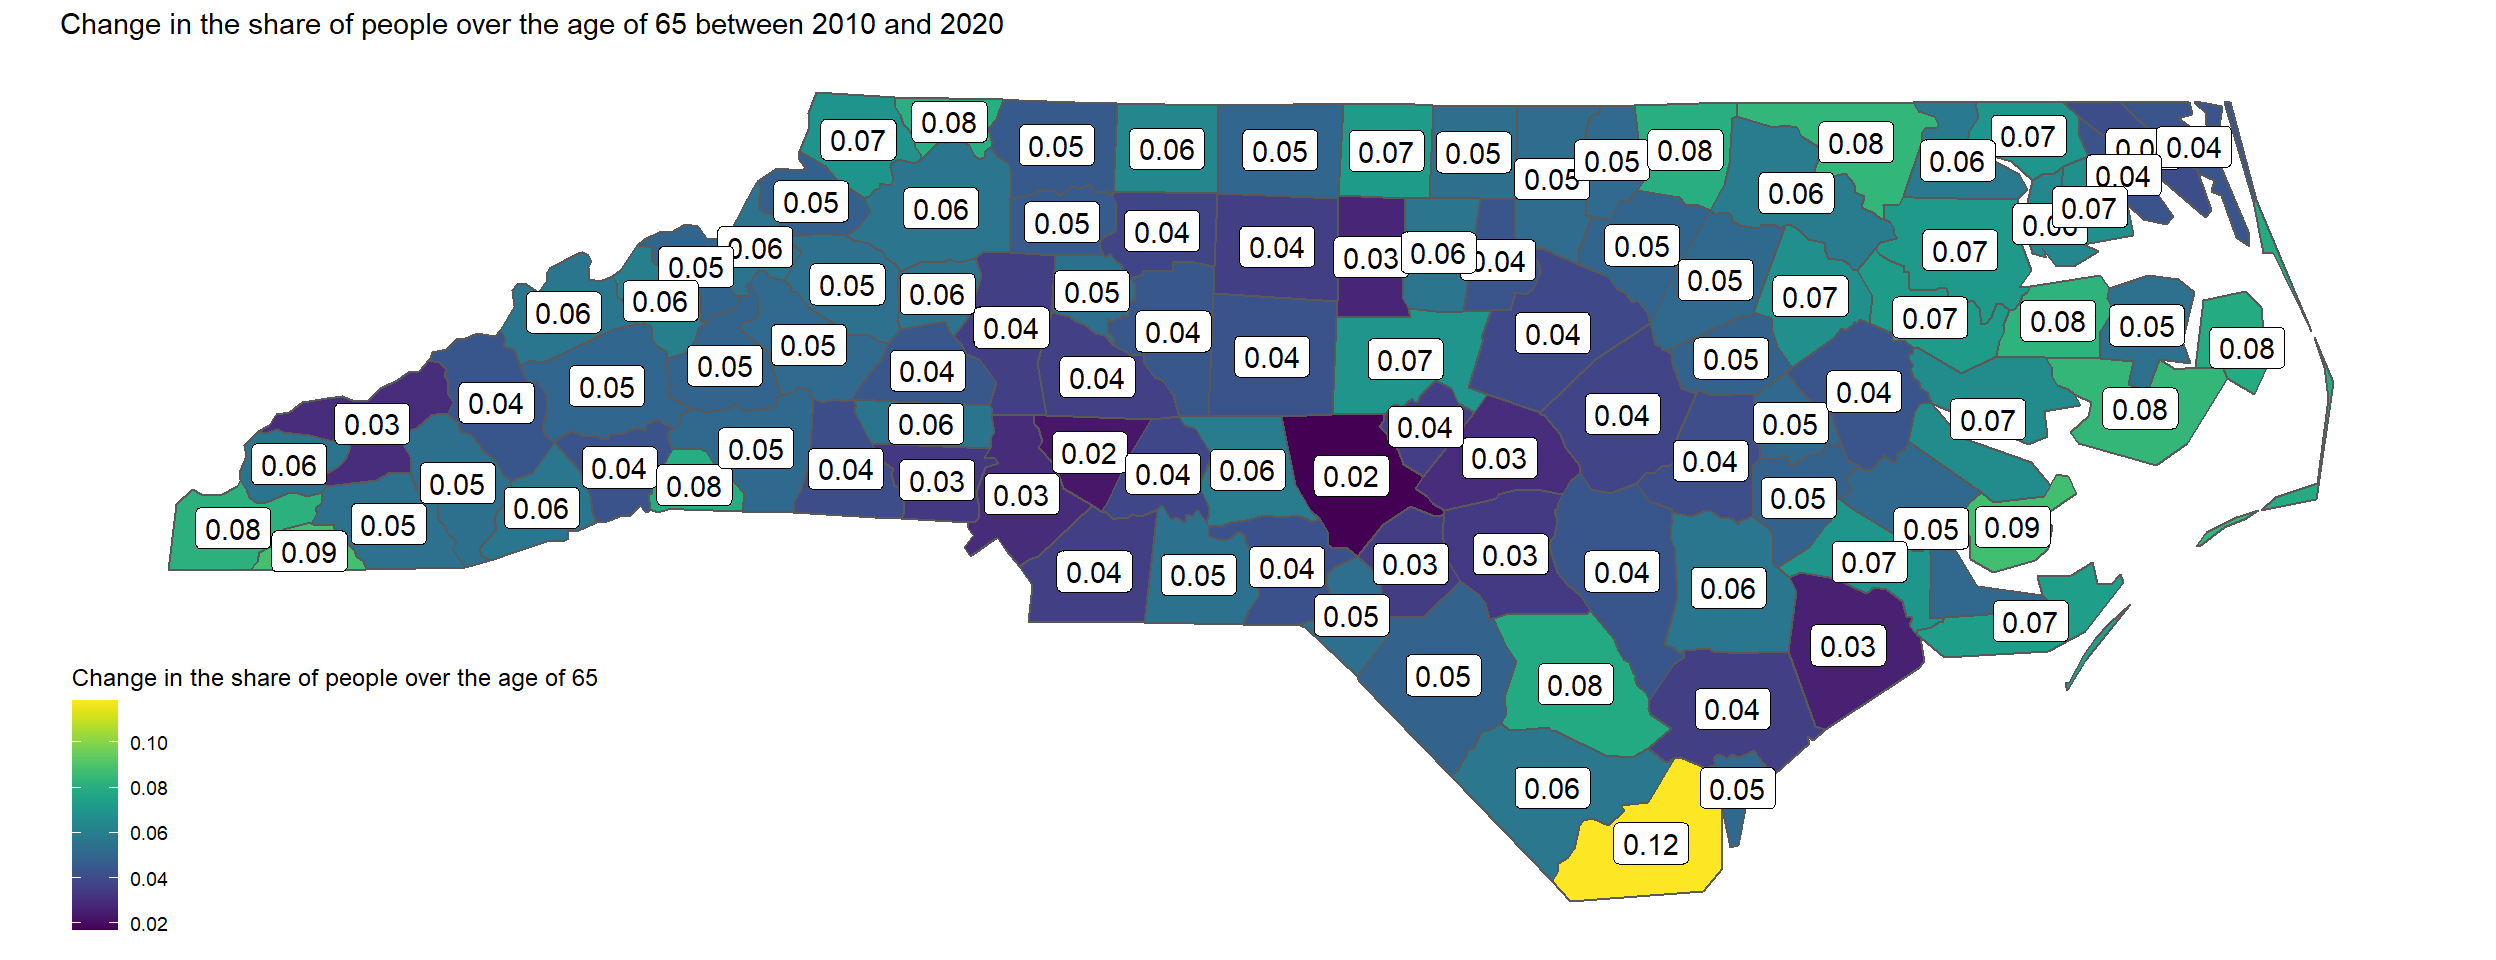
Figure 5: Change in the share of people under 5
Let’s zoom into the Wilmington Metro
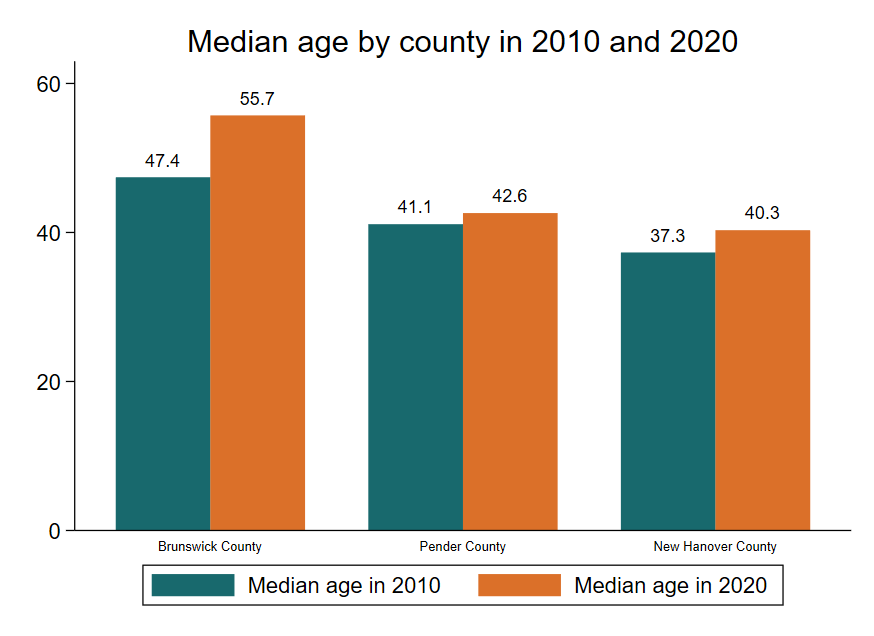
In Figures 6, 7, and 8 we zoom into the counties comprising the newly defined Wilmington metropolitan area (New Hanover, Brunswick, and Pender). In Figure 7, all three counties experienced an increase in median age with Brunswick experiencing an 8 year jump in median age.
Figure 6: Median age in 2010 and 2020 for Brunswick county, Pender county, and New Hanover county
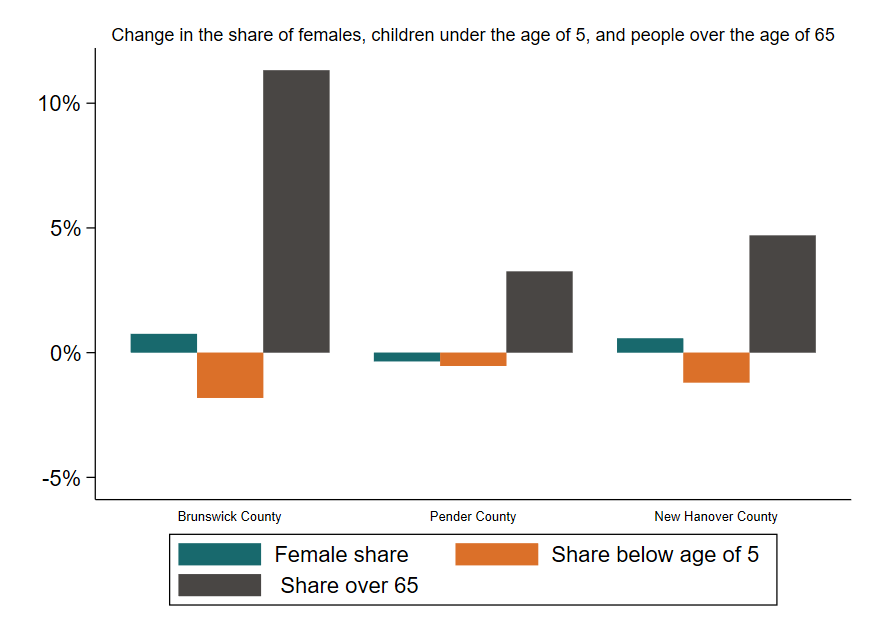
 All three counties in the Wilmington metro experienced significant growth even before the pandemic related migration. In Figure 8, we show that all three counties got older, had fewer children below the age of 5, and the female share has remained largely stable.
Figure 7: Percentage growth in population between 2010 and 2020 for New Hanover, Pender, Brunswick counties
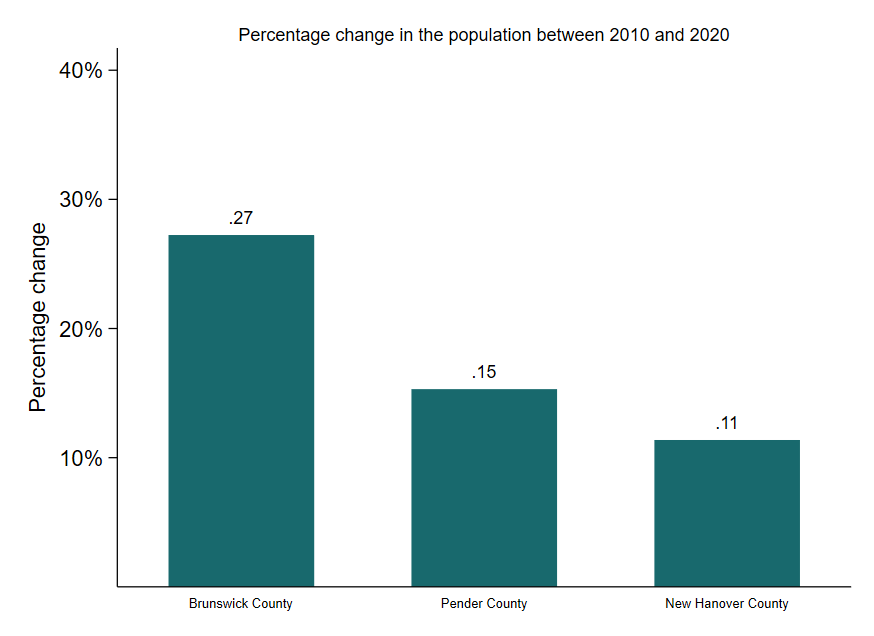
Figure 8: Female share, children under 5, and people over the age 65
What happened between 2020 and 2022?
The pandemic has caused considerable shifts in population across the country with the Sunbelt receiving an influx of new migrants. North Carolina, like the rest of the southeastern states, experienced a significant population boom adding 2.5% or 259,000 people. Even with this statewide growth, there was considerable variation with 25 counties losing population. The fastest growing county was Brunswick county at 12% and the slowest one was Northampton at -4%.
Figure 9: Population growth between 2020 and 2022
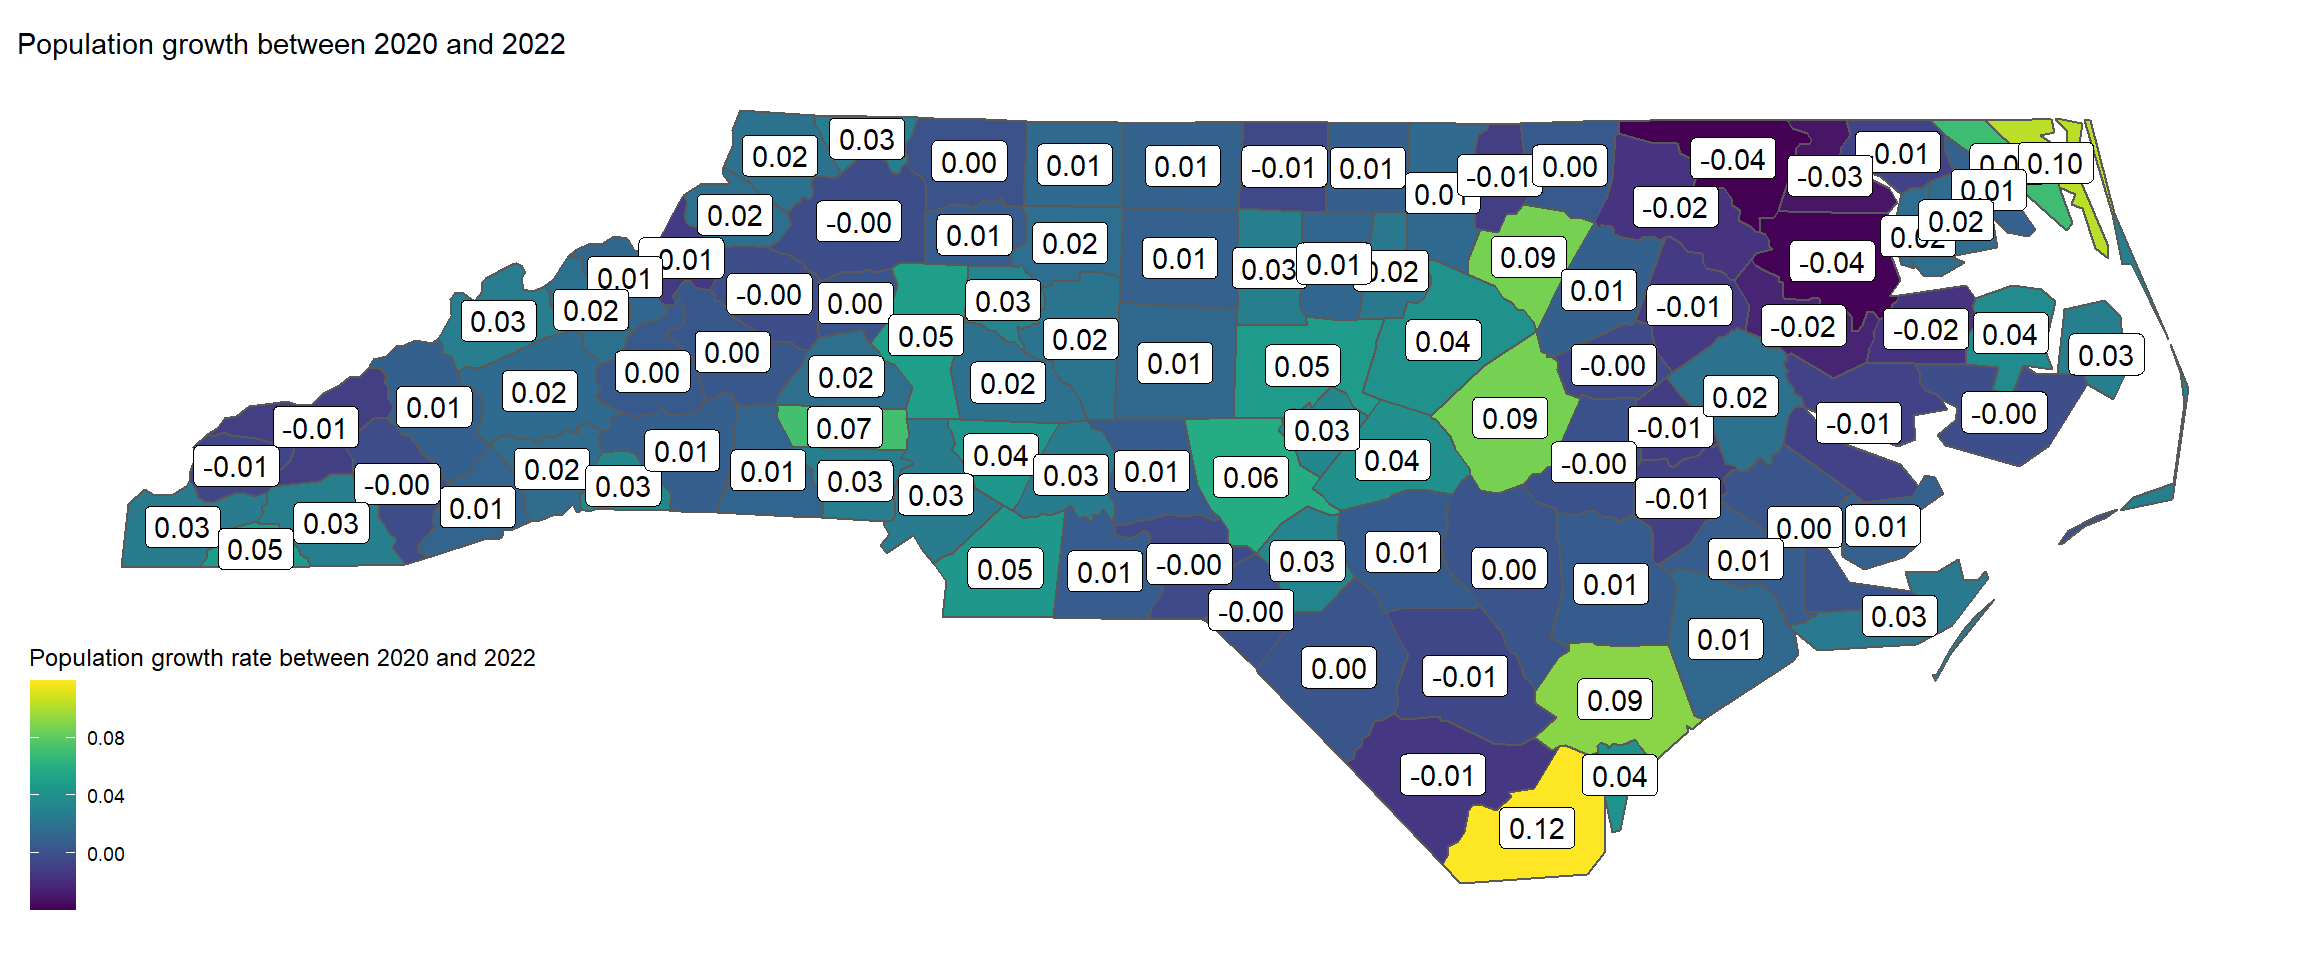
Given all these changes, we document below what the counties look like in terms of the female share, share of over 65, and median age.
Figure 10: Share of female population in 2022
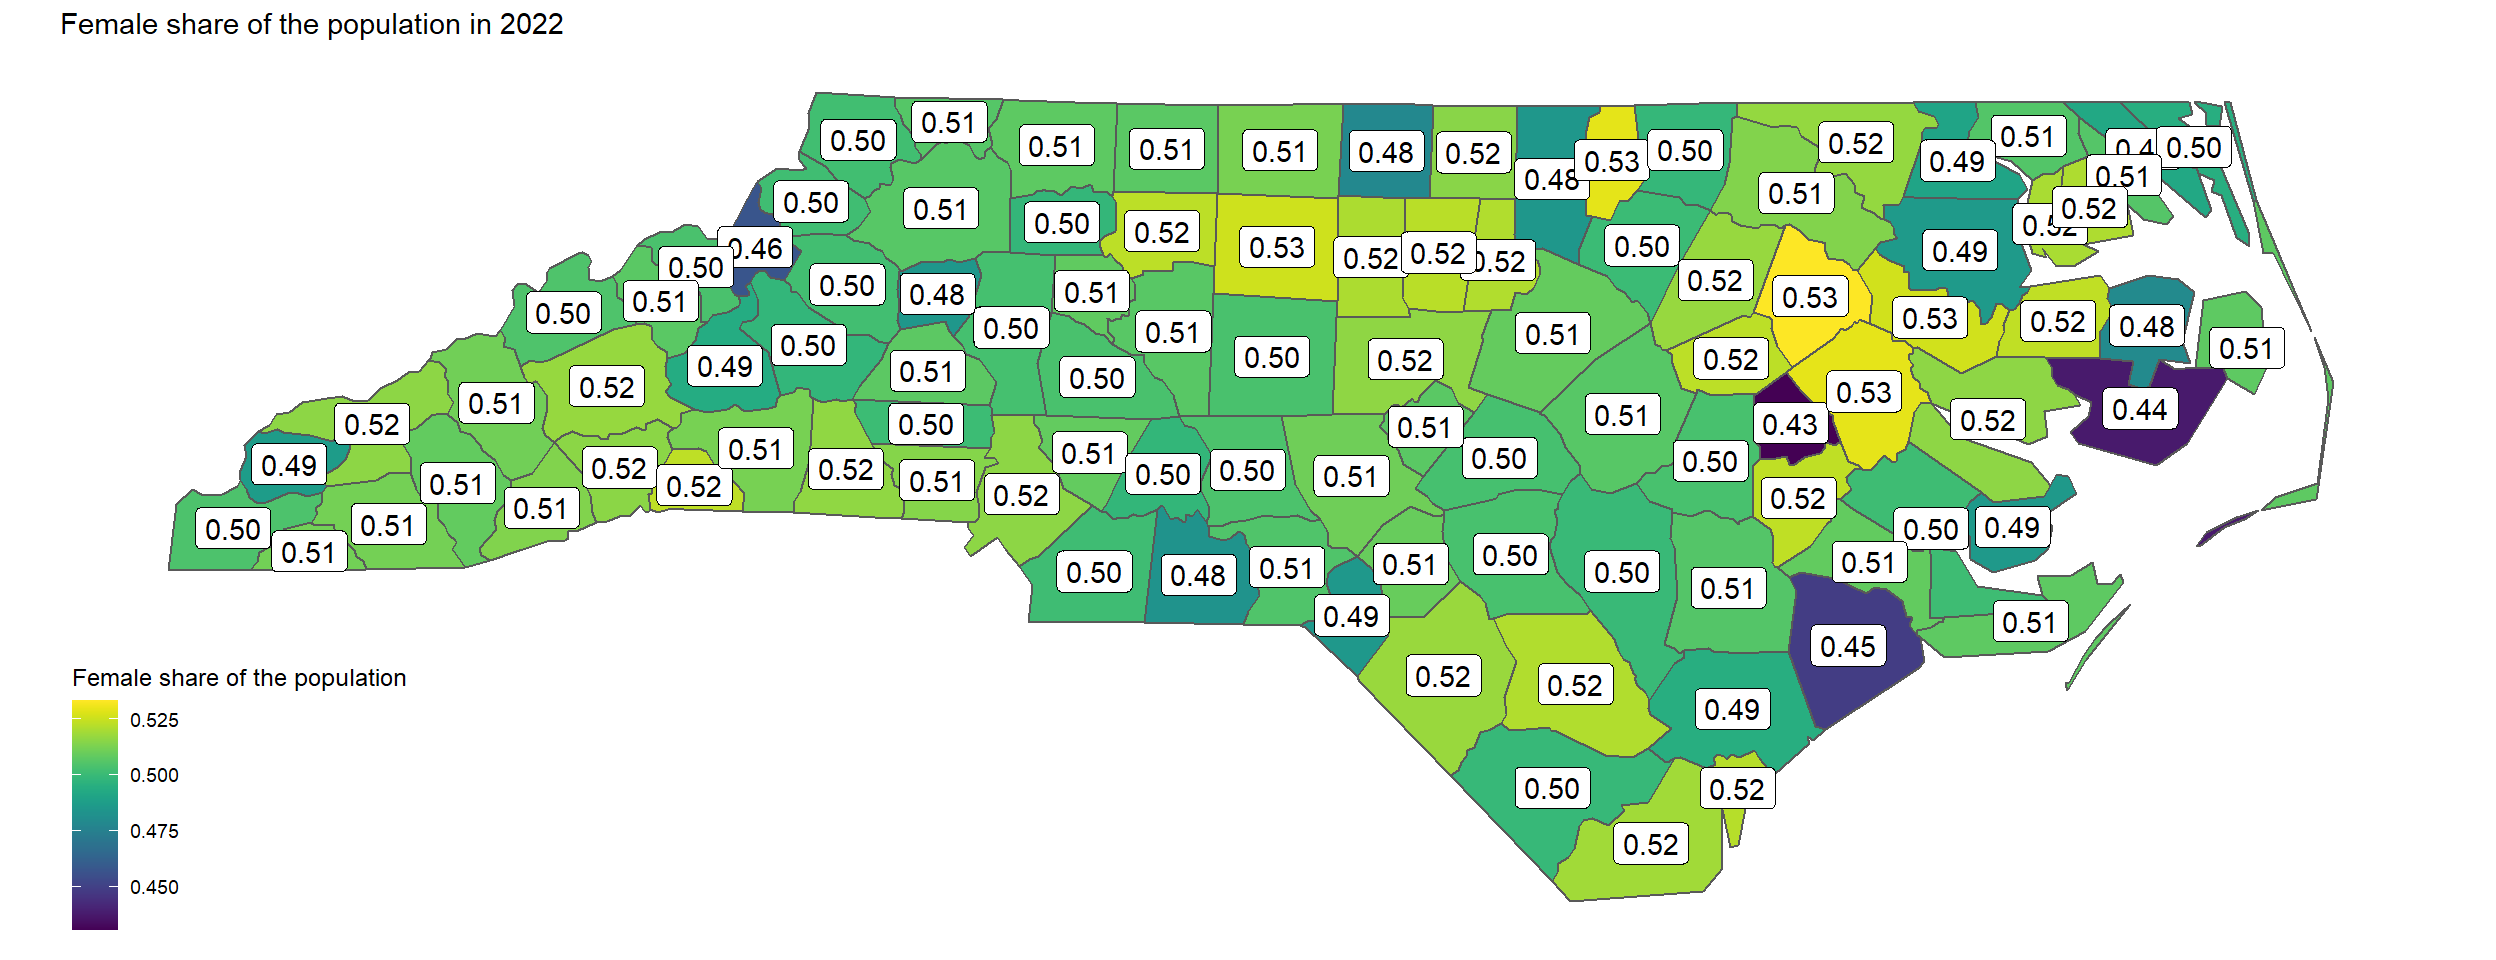
Figure 11: What is the share of population over 65?
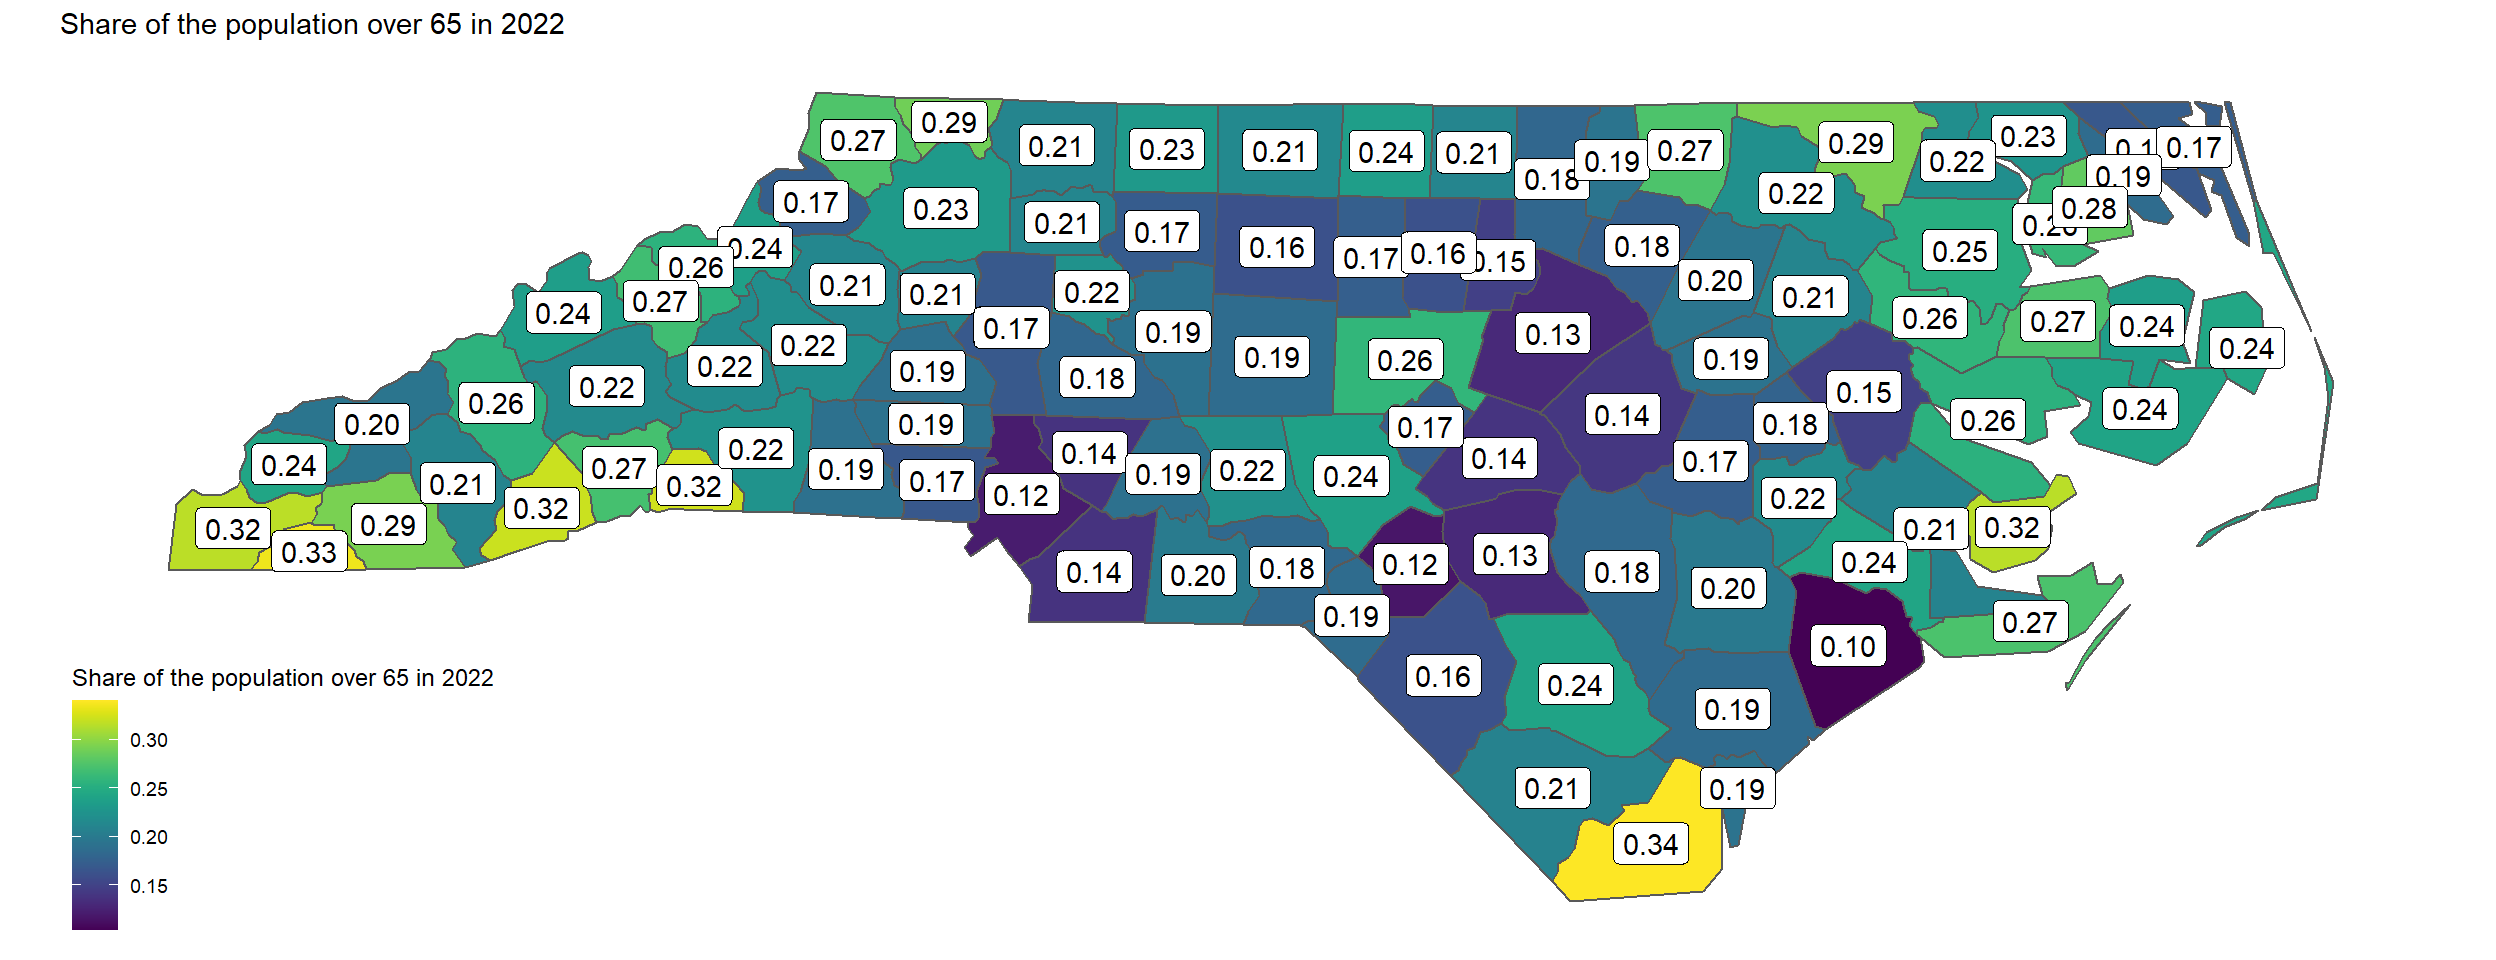
Figure 12: Median age in 2022
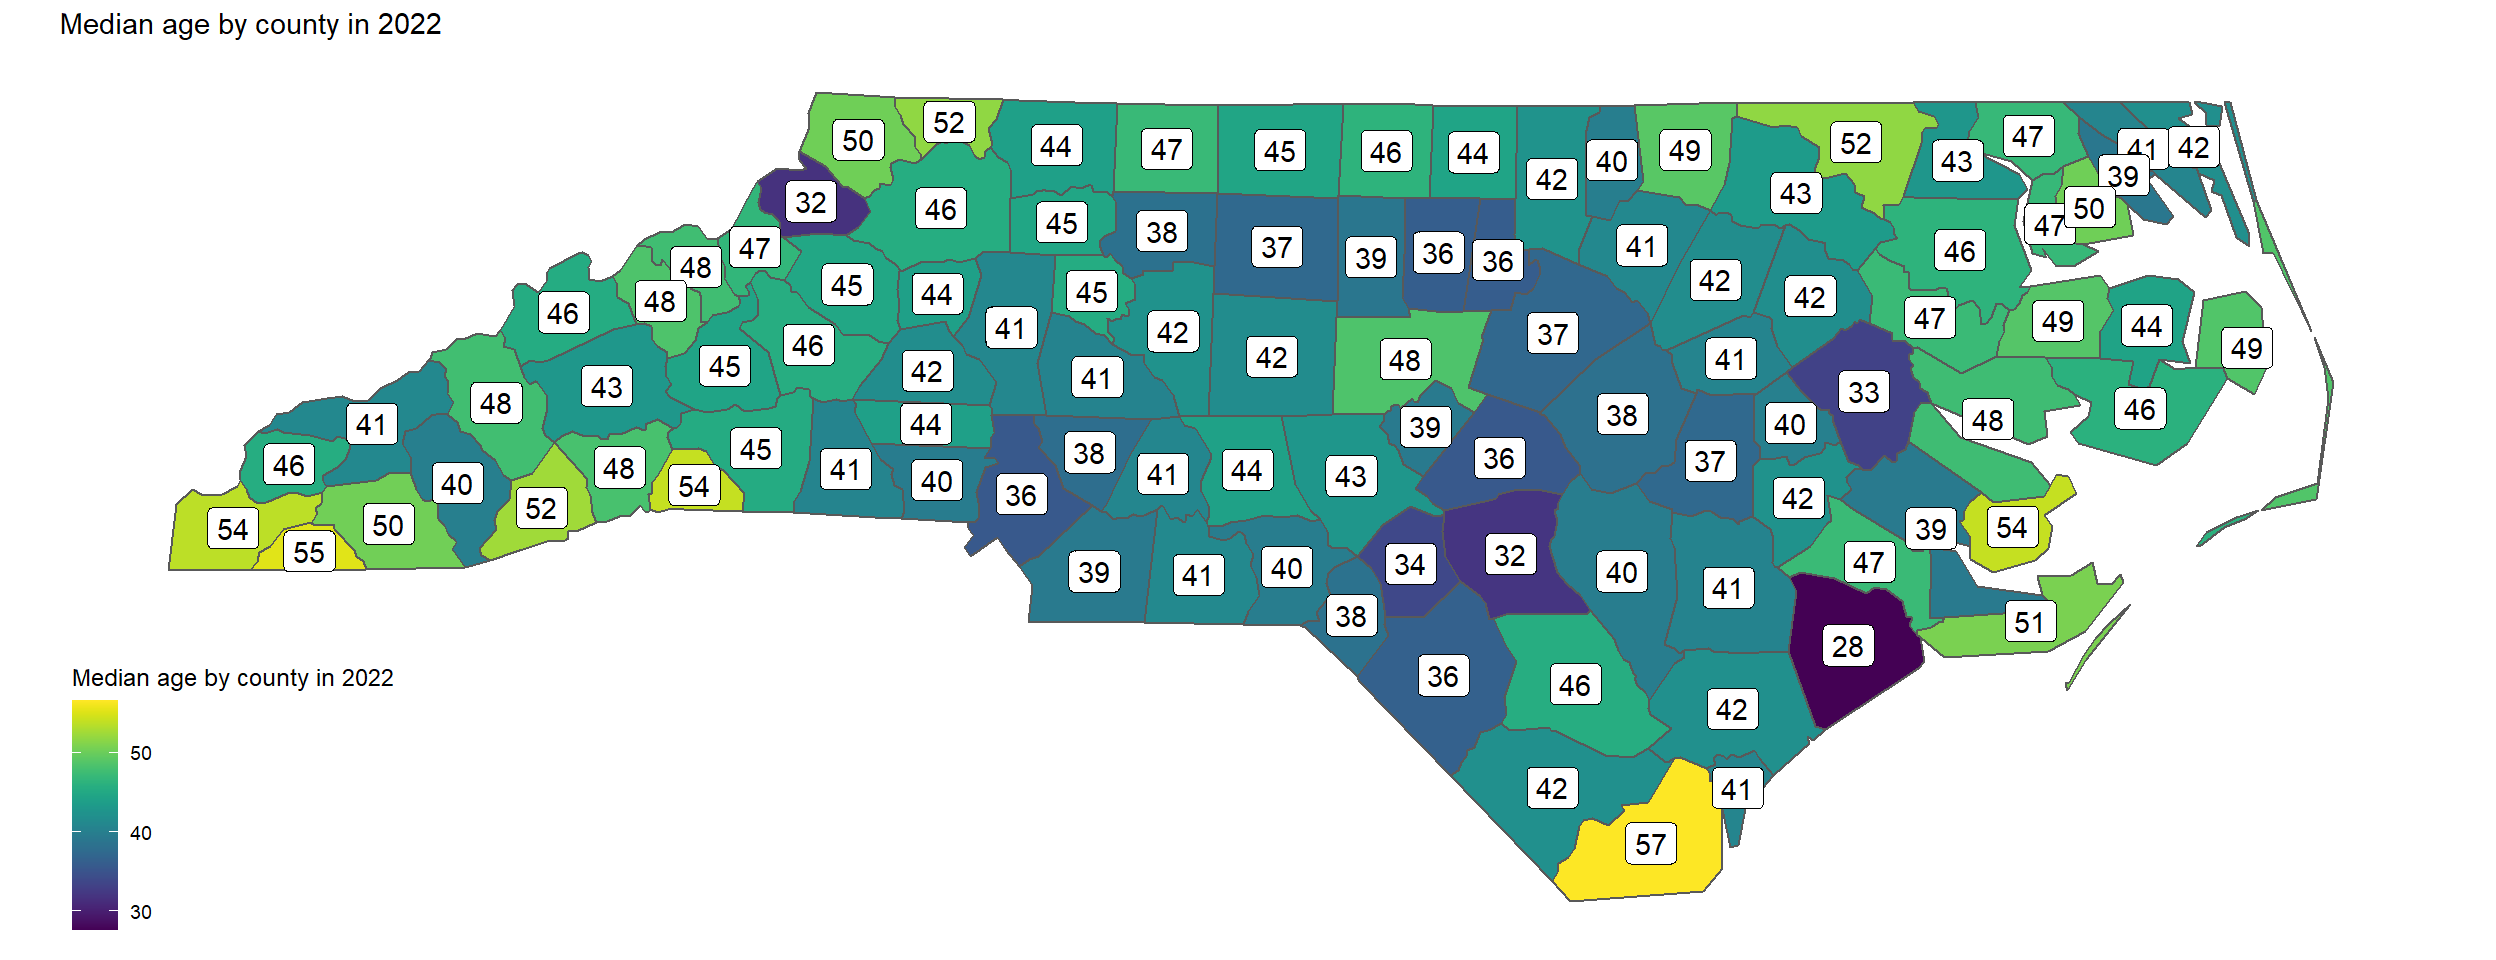
It is, unsurprising, that most counties across the state have a median age above 40 given that the state’s median age in 2022 was 39 years old. Brunswick county is the oldest county with a median age of 57 largely due to migration.
Growth, opportunity, and aging
There is no doubt that by most metrics the state of North of Carolina and the Wilmington metro have been growing by attracting both firms and individuals. It is also true that the state is getting older which will pose challenges to continued economic growth and economic development. Furthermore, the growth has not been even distributed as many smaller/rural counties are actually losing population even in the midst of this boom.